Group report
Project summary
As a group, we struggled a lot to get going for the project. There was an initial motivation, but a lack of communication, along with a loss of engagement with the project made for a difficult beginning. Assignments to sections of the project happened during one of the initial meetings, but work on them was done independently and without much communication between the team members. During this time, we lost contact entirely with one team member, who refused to answer emails, messages, any form of communication. This was a large worry, as he held a large position of responsibility over the project due to being chiefly in charge of visualisation.
Throughout the vacation we didn’t keep in contact as best we should, and again the project didn’t move very far forward. At this point we decided that given the missing member, someone should step in to write the visualisation section of the code, and so the load was made heavier due to this large responsibility. When we returned for the next term, a sense of urgency hit after a meeting with our sponsor and we realised that we really needed to get the project going and functioning. In the last couple of weeks, we met near every day and worked hard together to get the project to its best state.
In the end, we got the project working, although not to the quality we would have liked. We worked extremely hard on the project, and overall have found that it was a good exercise, and a useful lesson. In the future, we will aim to start strong and maintain that enthusiasm, keep communication quick and constant, and ensure that anyone not pulling their weight is quickly dealt with to avoid a heavy load being picked up rather later in the project. Also, we aim to put together a more basic version of the entire system earlier on, rather than developing our system parts individually and trying to get it to all work together at the end, which is a much harder and riskier method of going about the project.
Implementation
General
The following technologies have been used:
- Python as the main programming language.
- Java for the visualisation.
- Github for revision control and source code management.
- ØMQ for the networking.
- Protocol Buffers for network data serialization.
- Custom image of Raspbian as the Operating System for Raspberry Pis.
- Sphinx for documentation generation.
Statistics
- About 65% of Python code has been covered with unit tests.
- 82 files have been added, with total 7320 lines inserted.
Network
ØMQ and all 4 built-in core messaging patterns have been used for the networking:
- Request-reply for synchronization between:
- visualisation and the initializer,
- Raspberry Pis and the initializer (synchronized publisher).
- Pub-sub for distribution of the stock data to Raspberry Pis.
- Pipeline for collection of processed data from Raspberry Pis.
- Exclusive pair for synchronizing threads in the Controller.
Protocol Buffers have been used to serialize data. They are easy and allow to define messages and serialize it easily and cross language barriers. They generate source files in the given language. This means an interface consistent with the language and with type safety.
The system outline
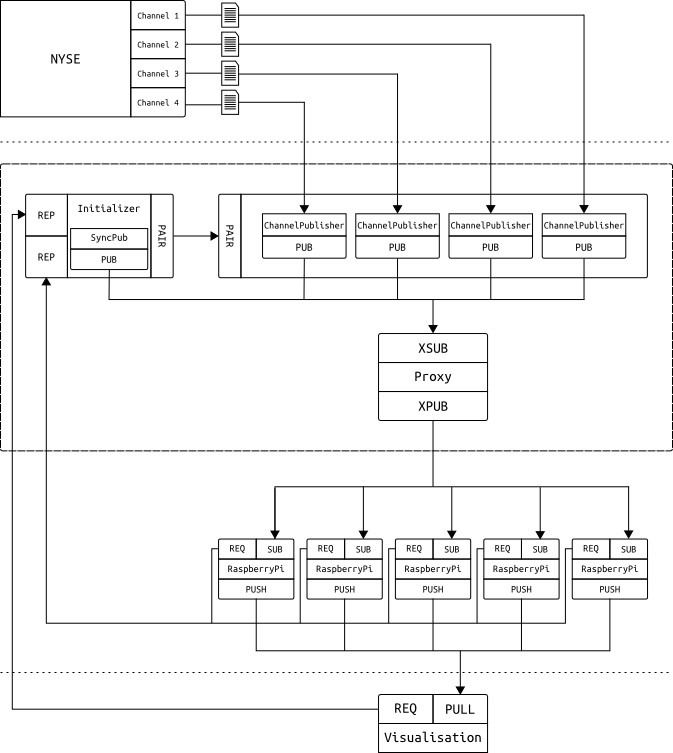
- Controller starts and spawns 3 different threads:
- The initializer parses stock’s symbol indexes to symbol names and price scale code (power of denominator) mapping and splits this mapping into several ranges. Number of ranges is determined from the number of Raspberry Pis which publisher expects to connect.
- The initializer waits for visualisation to issue a synchronization request on the REQ socket and replies on the REP socket with ranges of symbol indexes. Visualisation uses this data to display symbol names instead of symbol indexes and also to order data sent from Raspberry Pis.
- The initializer starts synchronized publisher which waits for expected number of Raspberry Pis to connect. Dummy data (ping) is published to the network through the proxy.
- When Raspberry Pi is turned on it starts to listen on the SUB socket and once data arrives it sends symbol range request on the REQ socket. The initializer replies on the REP socket. Each Raspberry Pi is assigned two different ranges to allow high availability of the entire system (ranges overlap between Raspberry Pis). Raspberry Pi subscribes to given range.
- Once all Raspberry Pis are connected, synchronized publisher dies and the initializer hands over to the master synchronized publishers thread over the PAIR socket.
- Master synchronized publisher thread spawns 4 threads, one for each
channel from NYSE. Each thread parses the channel file and publishes
the data through the proxy. Data is encapsulated in special envelopes
containing stock index and channel id to allow:
- subscriber prefix matching on Raspberry Pis
- easier ordering in the visualisation
- Raspberry Pis process the data in their order books and send the results over the PUSH socket.
- Visualisation listens for stock event messages incoming on the PULL socket and updates its UI respectively.
Note that this design allows scaling of both:
- number of channel parsers in case channels number increases/decreases;
- number of Raspberry Pis.
Parsing
NYSE Arca Integrated Feed is split into 4 different channels. Sample data can be downloaded from the FTP and it comes in 4 different files, one for each stream.
Each channel is a stream of packets containing variable number of messages of different type. Each packet starts with a packet header which contains e.g. the packet time and the number of messages contained and each message starts with a message header which contains the message type and its size. Parser runs on a single channel file, unpacking the headers and and parsing only relevant messages based on their type found in the header. Since Order Book needs only select message types, filtering is important for performance reasons: firstly not all of the messages are parsed and secondly less data is transmitted over the network.
Parsing module uses special framework built for this project only which allows easy extension of the code, e.g. by adding new messages or new message fields.
Order Book
The order book is the main processing code that runs on Raspberry Pis. The order book module consists of two books classes, one for demand and one for supply. The book keeps all the orders and allows changing them as well as querying for orders either by id or for the currently best order. Order book keeps a set of limit books for each limit price that is present. This seems natural since there will be lots of orders for a single price and some update orders can move order to the end of queue for the price. Each limit book the keeps orders at this price in first come first serve basis.
The whole book class is very modular and it can be connected with any collection for limit books as well as for structures. We chose to pick Fibonacci heap to store limit prices and Doubly linked list for individual orders for a single limit price. For limit prices we need to very efficiently add element and query for smallest element, also reasonably fast remove any element. Fibonacci heap allows the first two in O(1) and the second two in O(log N). For orders at a single limit price, the operations are the same, except we only add elements at the beginning or the end, doubly linked lists are perfect for this allowing all operations in O(1).
The matching engine class is the class that implements trading logic. It implements the rules of which order has a priority, in which cases changing the order loses its position in queue, what will be the price when there is larger interval of agreement. Matching engine is also a public interface for other modules to use.
Visualisation
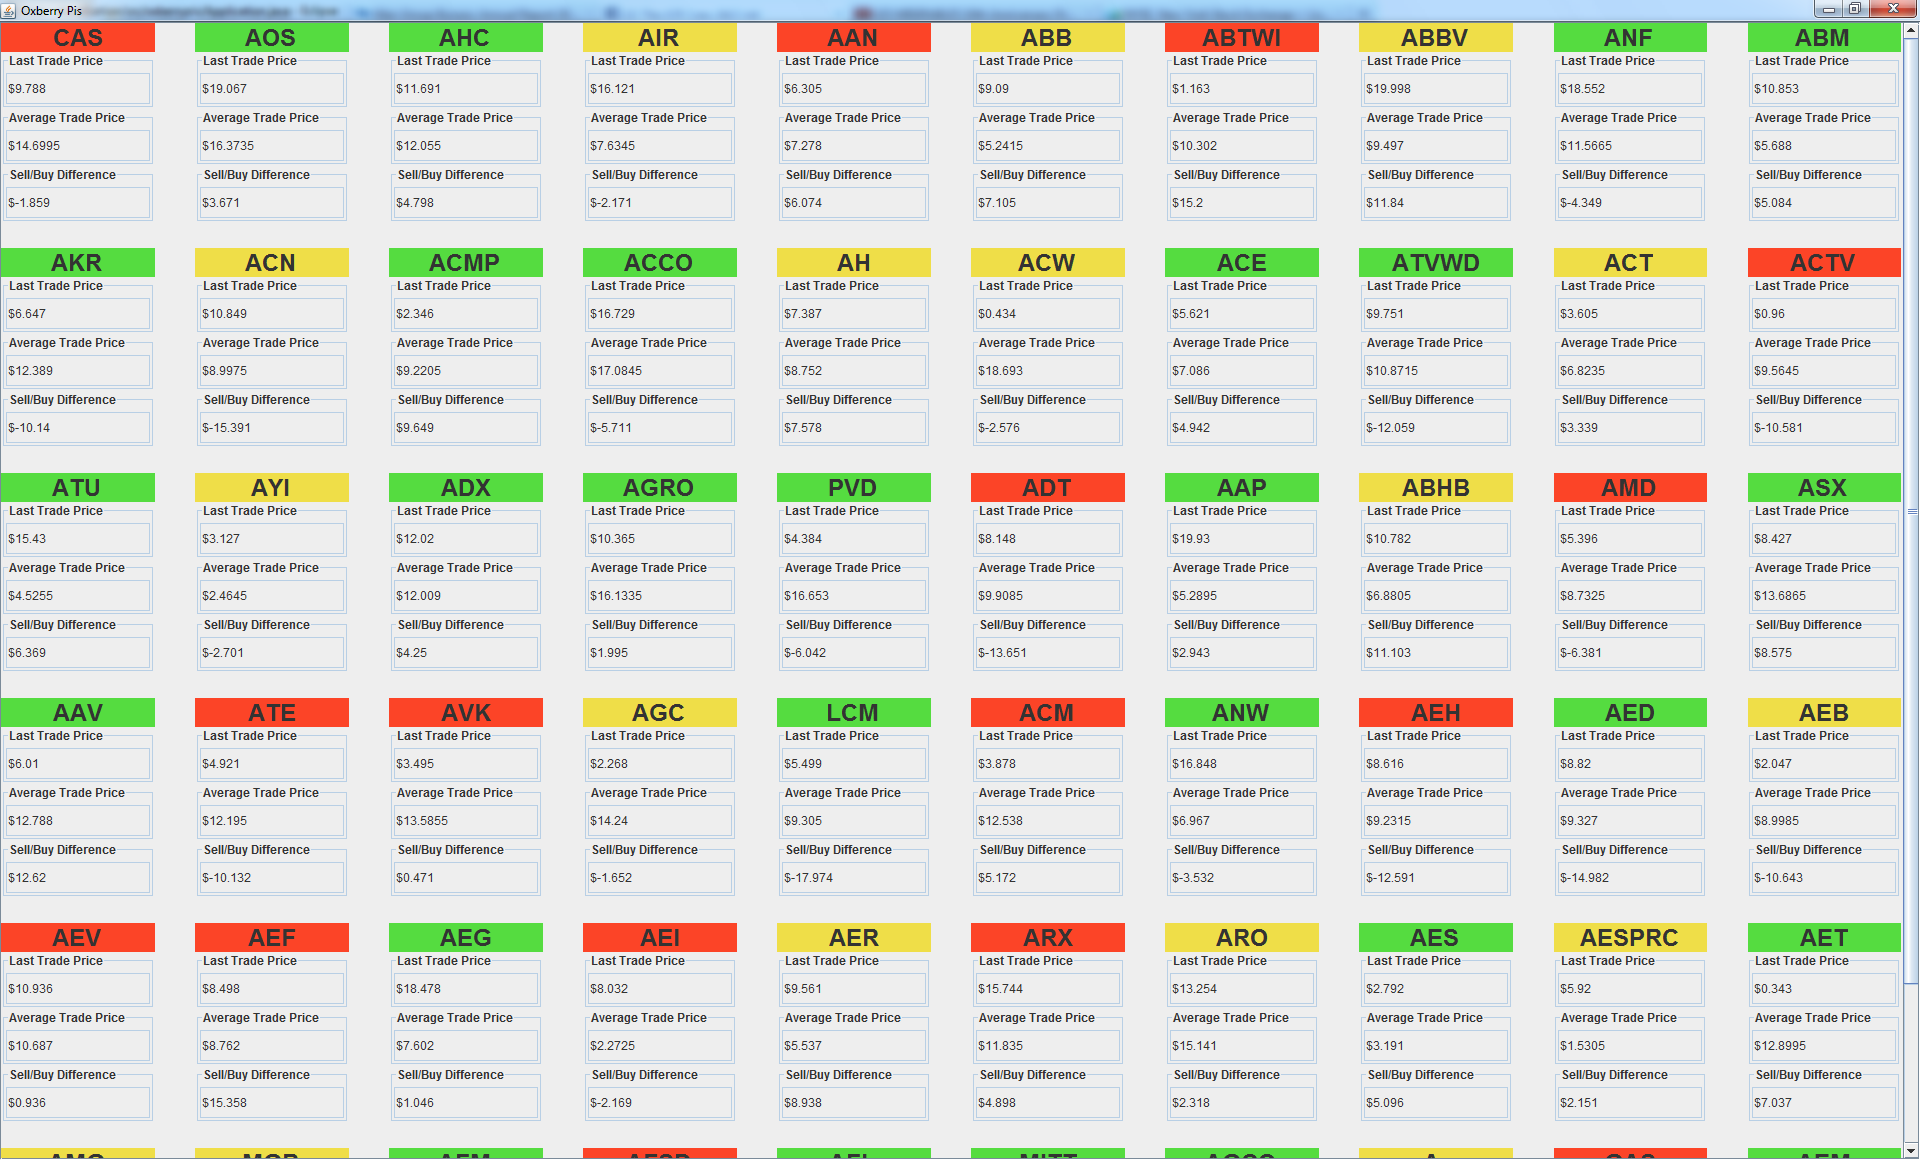
The visualisation section was implemented in Java, meaning that we made use of the Protocol Buffers to switch from the Python code to the Java. The only one that was used for visualisation was StockEvent, which provided a stock id, information on what channel it came from, sequence number which allowed to detect duplicates (produced due to the high availability model we used), along with optionally the last trade price, top buy price and top sell price.
A stock was given its own class, containing the stock name, last trade price, top buy price and top sell price. The stock name was obtained from a map sent from the parser, taking stock id to stock name. Each time a StockEvent came through, if the stock was already in the map, it was updated, otherwise it was added to the map.
The actual visual part of the project was written using Java Swing. A scrollable grid of each stock is shown, along with its last trade price, the average of its top buy and top sell prices, and the difference between the top buy and top sell prices. Each time a new trade price comes in, it is compared with the previous one and the cell of the stock changes colour depending on if the price went up, down or stayed the same.